Code
library(sfarrow)
library(arrow)
library(sf)
library(ggplot2)
library(ggrepel)
library(viridis)
library(dplyr)Guilford county’s NCWorks Career Centers provide job search assistance, career counseling, and skills training to residents across the county. The centers are located in the county’s two largest cities, Greensboro and High Point. This report visually investigates an important question:
Are the workforce centers in a convenient location to communities with the highest job support needs?
This project takes a first look at these questions. It maps labor market indicators including unemployment, poverty, and vehicle access across Guilford County’s census tracts, alongside the locations of the two career centers. This report visually surfaces where need is concentrated relative to where services are physically located.
Note: Click on the various Code sections to view the underlying code used in producing this report. The underlying code for fetching data from the American Community Survey and geocoding is available on my github page.
library(sfarrow)
library(arrow)
library(sf)
library(ggplot2)
library(ggrepel)
library(viridis)
library(dplyr)Data sources
Why census tracts
Census tracts are the standard small area geography for this kind of analysis. They are small enough to reveal neighborhood level variation, but large enough (typically 1,200 to 8,000 residents) to produce reliable estimates, unlike smaller geographies such as block groups. Tract level data of this kind is also standard input for the sort of underserved area analysis that informs public workforce funding decisions.
Distance calculation
For each tract, I calculated the straight line distance from the tract’s population centroid to the nearest of the two career centers. Distance calculations were performed in a projected coordinate system (NC State Plane, EPSG:2264) to ensure accurate measurement in feet before converting to miles. Mapping was done in unprojected geographic coordinates (WGS84) for standard latitude and longitude display.
guilford_acs <- st_read_parquet("data/guilford_tracts-2026-07-20.parquet")
centers <- st_read_parquet("data/career-centers-geo-2026-07-20.parquet")
ref_cities <- read_parquet("data/ref-cities-2026-07-20.parquet")

guilford_acs_proj <- st_transform(guilford_acs, crs = 2264)
career_centers_proj <- st_transform(centers, crs = 2264)
guilford_centroids_proj <- st_centroid(guilford_acs_proj)

dist_matrix <- st_distance(guilford_centroids_proj, career_centers_proj)

guilford_acs_proj <- guilford_acs_proj |>
  mutate(dist_to_nearest_center_miles = apply(dist_matrix, 1, min) / 5280)

guilford_acs <- guilford_acs |>
  left_join(
    st_drop_geometry(guilford_acs_proj) |> select(GEOID, dist_to_nearest_center_miles),
    by = "GEOID"
  )

career_centers_coords <- centers |>
  mutate(lon = st_coordinates(geometry)[, 1],
         lat = st_coordinates(geometry)[, 2]) |>
st_drop_geometry()The map below shows each census tract in Guilford County, shaded according to the unemployment rate. Note that the NC Service locations are not in the census tracts with the highest unemployment rates.
ggplot(guilford_acs) +
  geom_sf(aes(fill = unemployment_rate)) +
  scale_fill_viridis(name = "Unemployment\nRate", labels = scales::percent) +
  geom_point(data = career_centers_coords, aes(x = lon, y = lat),
             color = "red", size = 3, shape = 17) +
  geom_label_repel(data = career_centers_coords,
                    aes(x = lon, y = lat, label = name),
                    size = 3, fontface = "bold",
                    box.padding = 0.5, segment.color = "red") +
  geom_text_repel(data = ref_cities,
                   aes(x = long, y = lat, label = name),
                   size = 2.8, color = "gray90", fontface = "italic",
                   box.padding = 0.4, max.overlaps = 15,
                   min.segment.length = 0, seed = 42) +
  theme_minimal() +
  labs(title = "Unemployment Rate by Census Tract, Guilford County, NC",
       subtitle = "NCWorks Career Center locations shown in red")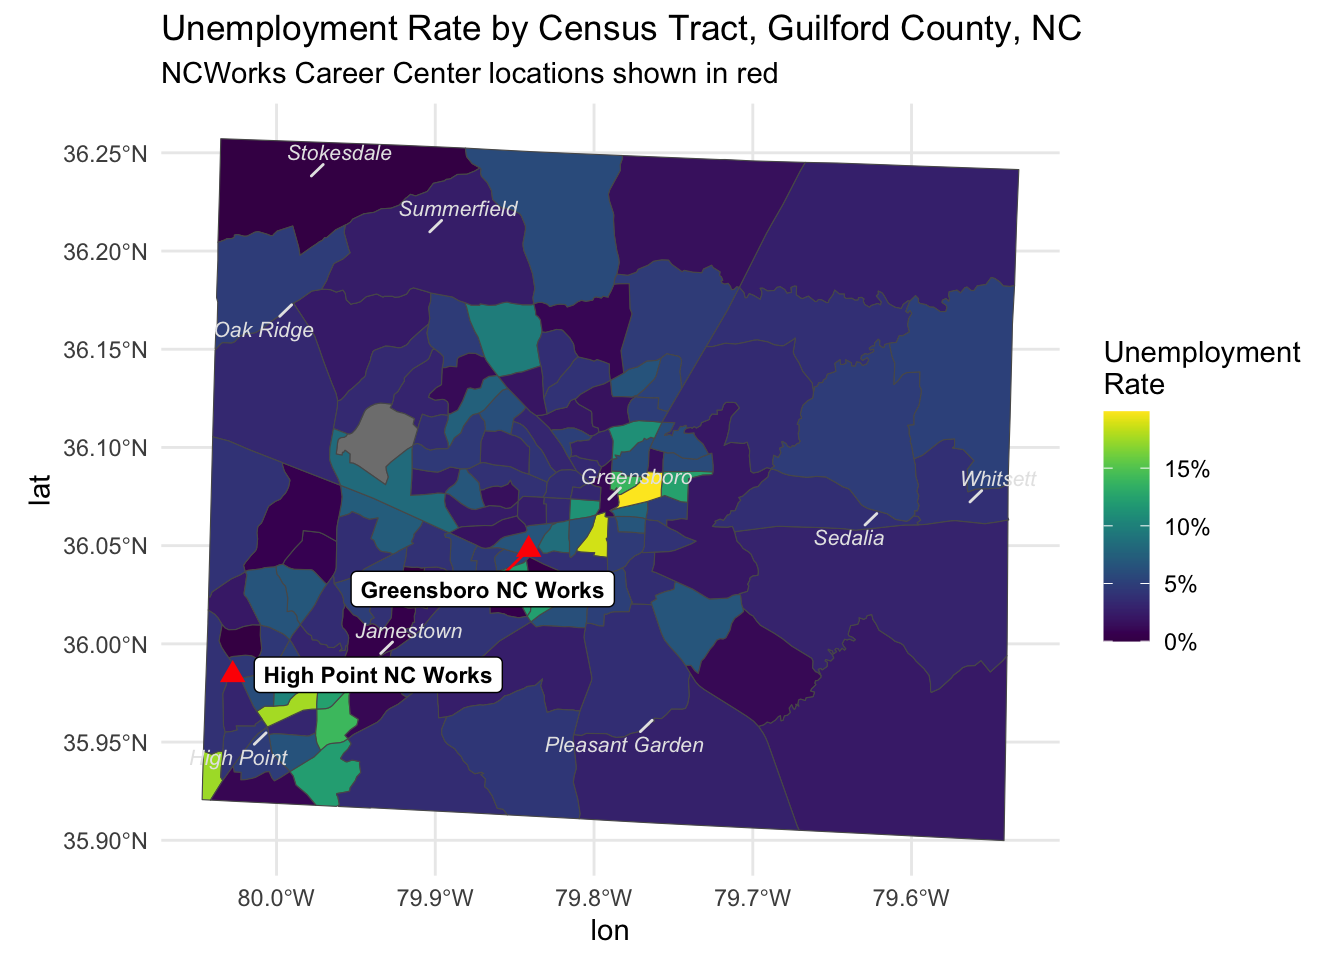
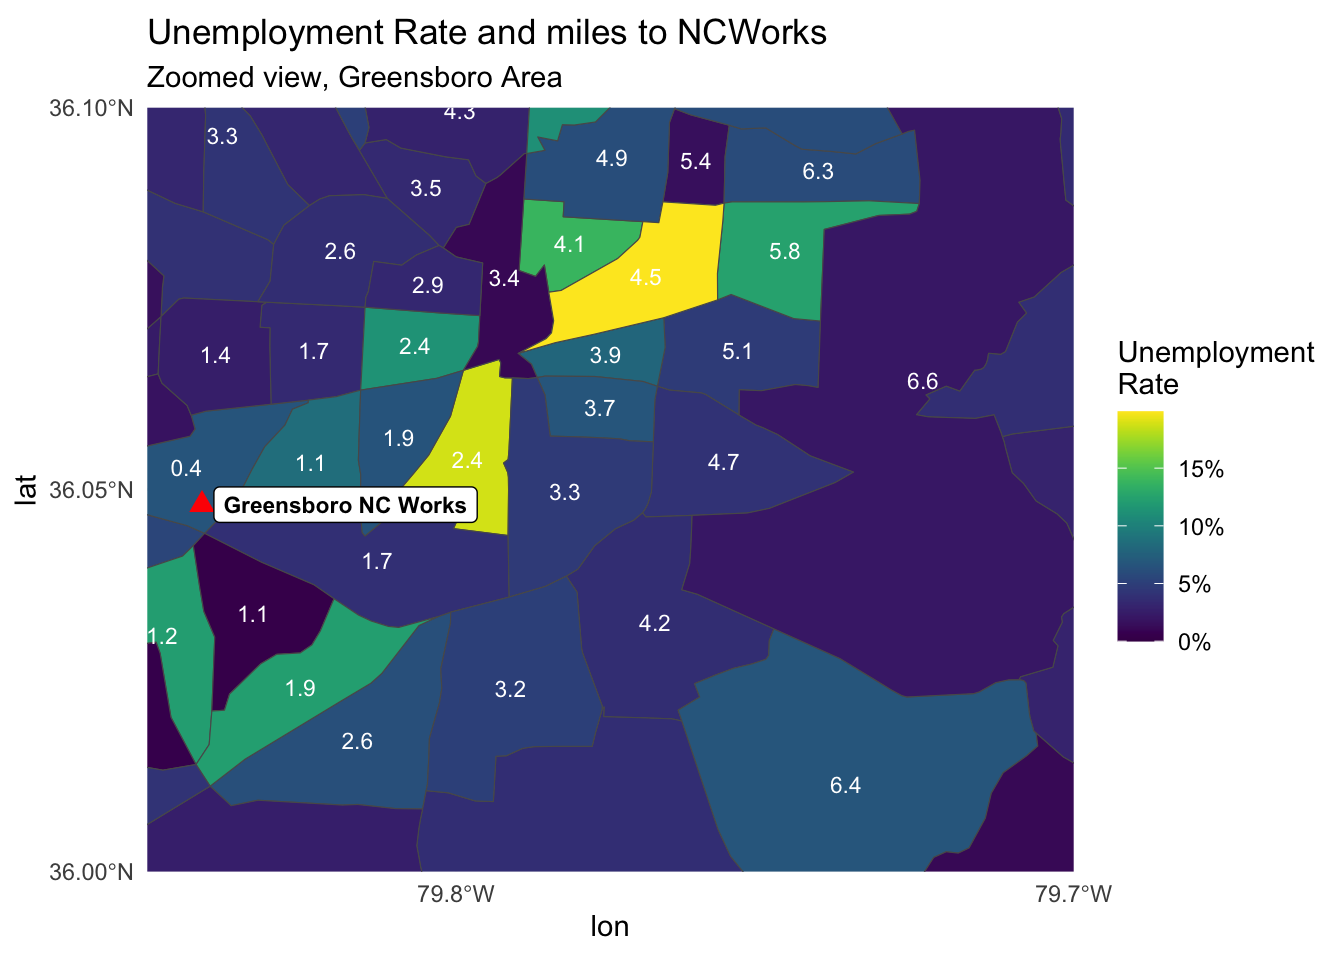
This second choropleth graph shows the average number of miles to the NCWorks location. The two Greensboro-area tracts with the highest unemployment have average distances of 2.4 and 4.5 miles to the NC Works location. This can pose a burden to residents without vehicle access. In the census tract where Greensboro NC Works resides, the average distance is less than half of a mile, but there is a lower need for employment services in this tract.
guilford_centroids_coords <- guilford_acs |>
  st_centroid() |>
  mutate(
    cent_lon = st_coordinates(geometry)[, 1],
    cent_lat = st_coordinates(geometry)[, 2]
  ) |>
  st_drop_geometry()

ggplot(guilford_acs) +
  geom_sf(aes(fill = unemployment_rate)) +
  scale_fill_viridis(name = "Unemployment\nRate", labels = scales::percent) +
  geom_point(
    data = career_centers_coords %>% filter(name == "Greensboro NC Works"),
    aes(x = lon, y = lat),
    color = "red",
    size = 3,
    shape = 17
    ) +
  geom_label_repel(
    data = career_centers_coords %>% filter(name == "Greensboro NC Works"),
    aes(x = lon, y = lat, label = name),
    size = 3, fontface = "bold",
    segment.color = "red"
    ) +
  coord_sf(xlim = c(-79.85, -79.70), ylim = c(36.00, 36.10), expand = FALSE) +
  theme_minimal() +
  labs(title = "Unemployment Rate and miles to NCWorks",
       subtitle = "Zoomed view, Greensboro Area") +
  scale_x_continuous(breaks = scales::pretty_breaks(2)) +
  scale_y_continuous(breaks = scales::pretty_breaks(2)) +
  geom_text(data = guilford_centroids_coords,
            aes(x = cent_lon, y = cent_lat,
                label = round(dist_to_nearest_center_miles, 1)),
            size = 3, color = "white")